Project Starts
Analytics Report
Get a backward and forward view of project start dates across the UK construction industry to plan your pipeline.

3,000 companies win more work with Barbour ABI







See what's ahead. Ahead of everyone else.
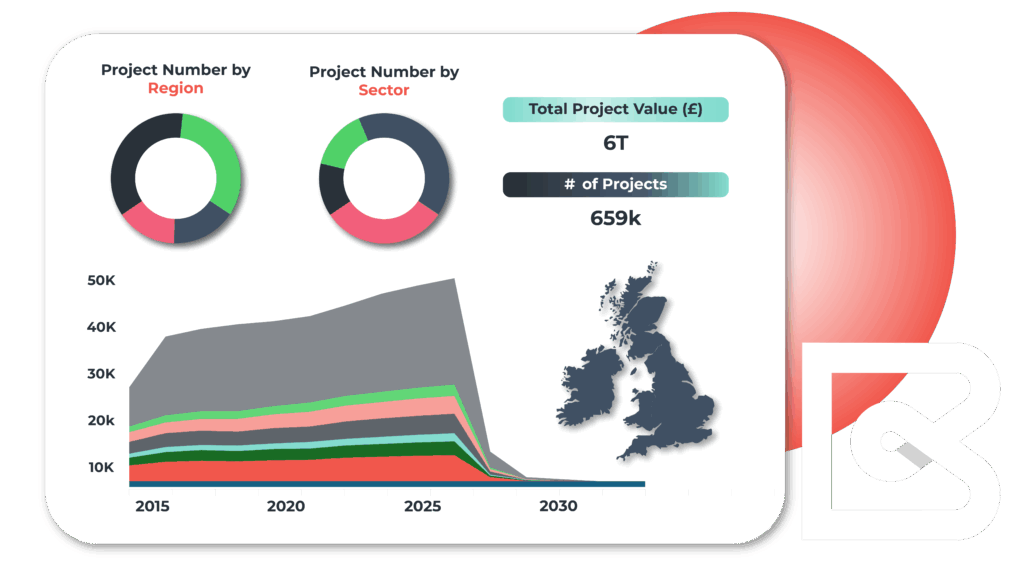
Gain a unique view of what’s most likely to start and when with our Project Starts Analytics Report.
The report features a forward and backward view of project start dates to give you the clearest path to understanding realistic upcoming start dates.
Subcontractors, Hire Services, and Building Material Manufacturers use this data to accurately start selling at the right time.
This is how you feed your forecast
Robust forecasting
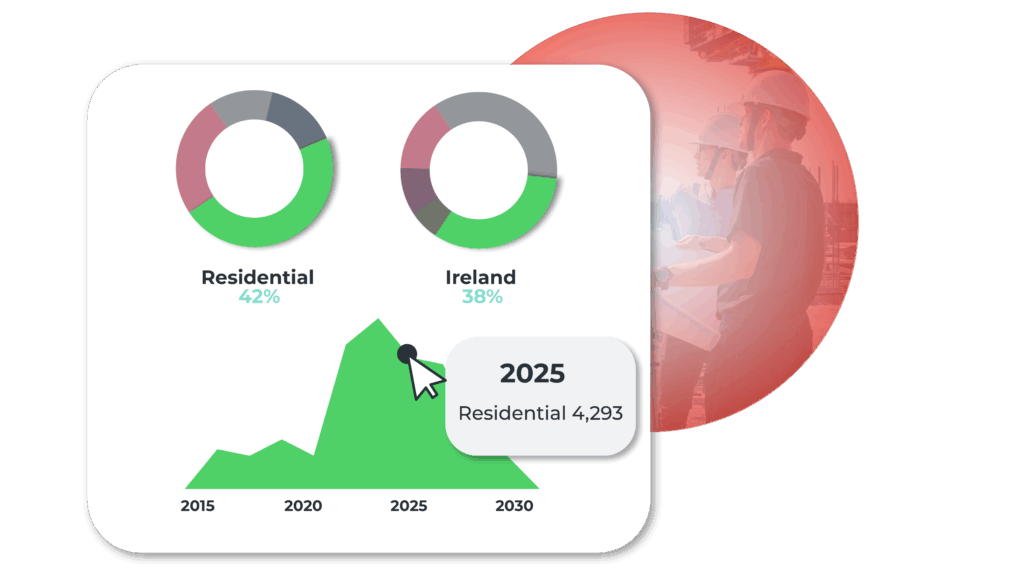
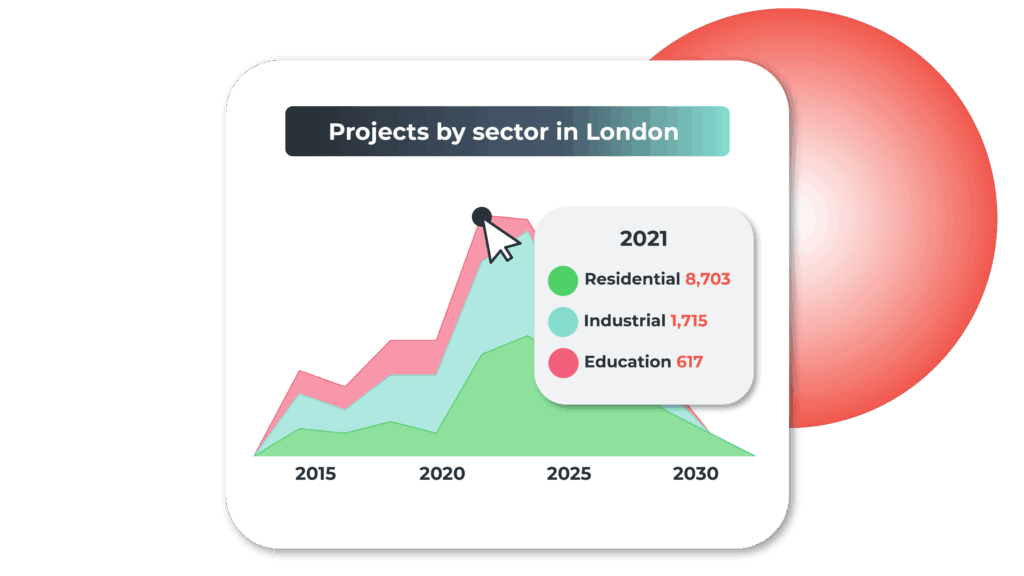
Use the Project Starts Analytics Report as a forecasting tool to understand what’s coming and see the best regions and sectors to direct your efforts.
Focused targeting
Drill down into the data and view related contact details, roles and relationships for all projects you’re interested in, directly in the Barbour ABI platform.
Quarterly updates
Fuel your future strategies with the most up-to-date data with quarterly updates from our experts automatically applied to your reports.
Inside the Project Starts Analytics Report
Start right with confirmed timings
Project start dates aren’t always reliable, that’s why our team of experts confirm 92% of project timings at the time of contract award.
Use this data to start acting on projects we know will happen in your target sectors and regions to fast-track your pipeline opportunities.
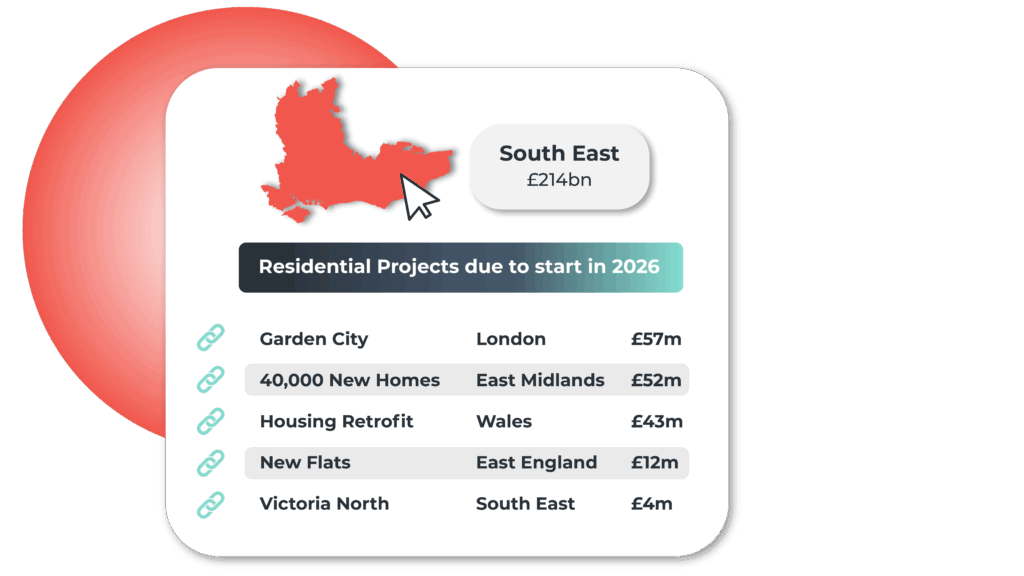
Want to see the upcoming Infrastructure projects set to start in 2026 across the South West? In just a few clicks, your pipeline of work is built before your eyes.

Drill deeper into the detail
Use the insights from the Project Starts Analytics Report to find the people and companies you need to be speaking to before the project goes on site.
From the report straight to our Construction Project Leads Platform, you can drill through to specific project information of each company.
From here you can find contact details of key decision makers found on the platform, along with other project details, bidder history, and more.
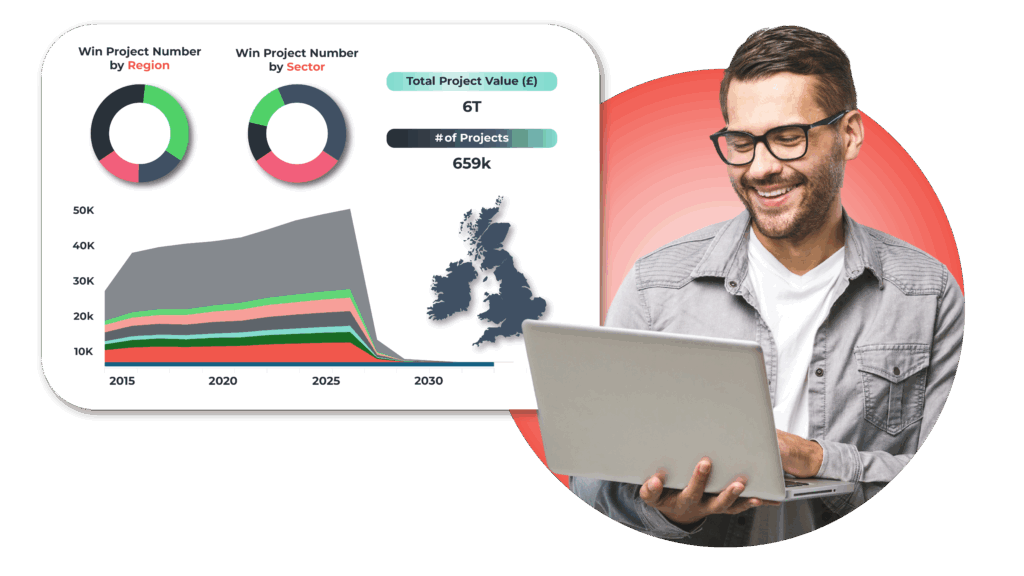
Get there before the start
The Project Start Analytics Report is your new forecasting tool that gives you instant visibility of the entire construction project universe set to begin.
The window between planning approval and starting times can be the clearest opportunity to selling your products or services earlier than everyone else.

See the report in action today
See how our Project Starts Analytics Report leads the industry to data-driven success.
Explore more of our Analytics Report Library
Contractor Win Rates Report
See who wins and loses, on which projects, and feed your bidding strategy.
Home Improvement
Report
Discover planning application and approval totals for UK Home Improvement
Supply Chain
Report
View how major players in the UK are working together and on which projects.
“I used to use a competitor for 20 years and thought their intelligence was superior.
However now as a Barbour ABI customer I have had a big change of heart and rate their research and data very highly.”

“An awesome platform to use as a technical sales consultant.
Barbour ABI provides team training and share helpful hints and short cuts.
I can’t shout loudly enough in support of Barbour ABI.”

FAQs
Yes. In order to fully benefit from the Analytics Reports, it’s necessary to have access to our Construction Project Leads Platform.
A platform subscription means you can delve deeper into the data, and view project and company details associated with the report insights for seamless opportunity targeting.
All Barbour ABI Analytics Reports are refreshed with updated data on a quarterly basis. Subscribers of the report will be able to view this new data automatically from the same interface.
Power BI is Microsoft’s business analytics platform that allows users to take their data and turn it into visualisations. These visualisations clear the way for better, actionable insights.
Our data specialists use Power BI to build our range of Analytics Reports to bring you powerful intelligence and actionable insights.
You do not need access to Power BI to use the Barbour ABI Analytics Reports.
Aggregated data is information compiled and summarised from various, individual data points.
At Barbour ABI, we use this method within our Analytics Reports to show trends, patterns and averages over time to bring you the valuable insights you need.
We’ve developed our range of Analytics Reports to cater to the specialist demands of all sales, marketing, project management, strategic and analytics professionals.
There are reports that provide insights for a wide variety of built environment businesses, including:
- Main Contractors
- Specialist contractors and subcontractors
- Product Manufacturers
- Merchants
- SMEs
- Large businesses, including those with regional offices, franchises and depos
Our experts can assess your specific needs and provide you with details of the ideal report for your business.
